Dashboard
Dashboard provides statistics for the resources of your account. Here you can see the total stats for projects, scrapers, and separate stats for each of them.
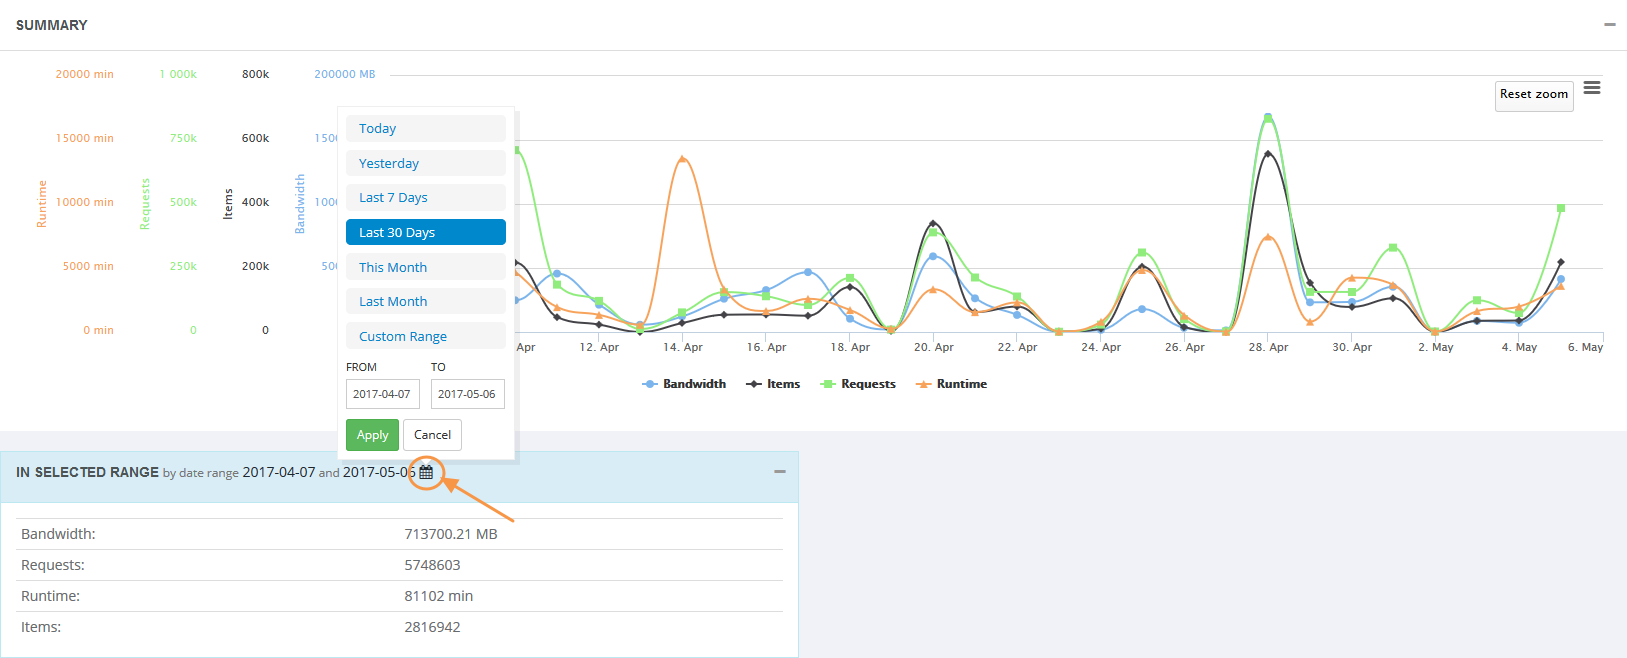
Summary stats
To view statistics in the required date range, you need to click on the calendar icon, (shown in the screenshot) and select the required range. The graph and the table will show the summary statistics for the selected dates.
Resources left
In this area you can see the account's remaining resources for the current billing period of your subscription plan. The bandwidth is free, so the main consumable resource is the number of web-resource requests (page requests, ajax calls, document requests etc).
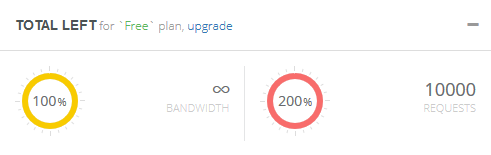
For each request to an external resource the system will charge one page Request from your balance. Diggers will be stopped and not be able to continue when this resource (page requests)is depleted. Resources will be automatically restored to the level of your current subscription plan when the new billing period starts and diggers can continue to work. If you do not have enough requests, but you do not want to wait for the automatic resources update, you can upgrade to any paid subscription plan, get resources and start to work again.
Overview
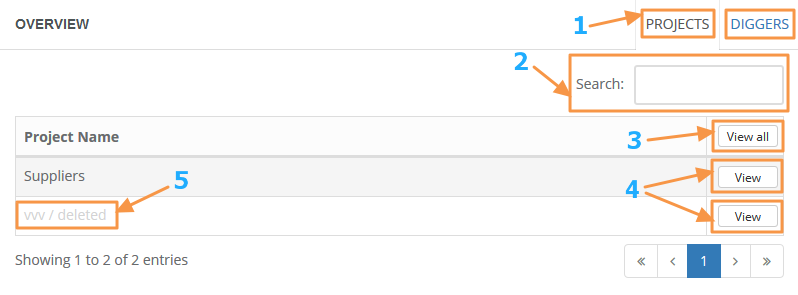
The overview panel provides the ability to view statistics separately for projects or diggers (item 1 in the figure). For each section there is an option to view all at once (item 3) or each separately (item 4). If you have a lot of projects or diggers, you can use the search field (item 2) and find the digger or project you need. Please note, in order to save the statistics, we do not delete the general information about the projects and diggers from the system completely. You can always see how much resources were spent by deleted projects or diggers. In the table they are shown in a muted color (item 5).
Recent activities
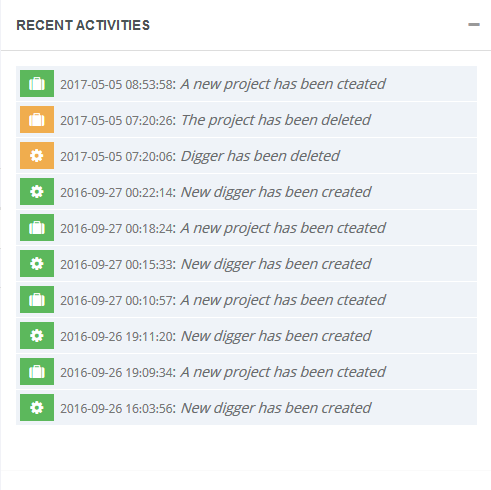
This table provides information for the latest actions taken by you or the system for your account.
Next